
Capping the best year for the job market since the recession began eight years ago, employers added 252,000 jobs in December 2014. It was the eleventh month in a row that employment rose more than 200,000—the longest such streak since 1995. Of course, thanks mainly to immigration, U.S. population is considerably larger now than it was in 1995. So in percentage terms this job figure is not remarkable.
But for native-born Americans, the headline-grabbing job performance of recent years is a cruel joke. All of the net gains in jobs since 2007 have gone to legal and illegal immigrants. Which means that fewer native-born Americans are working today than were at the end of 2007.
At VDARE.com, we have tracking been tracking this immigrant displacement of American workers every month since 1994. Our findings have been recently confirmed by a new report [PDF]from the Center for Immigration Studies—although CIS, following its usual uncouth practice, does not acknowledge our priority.(See “Shock Study”–CIS, DRUDGE, And NRO Repeat What VDARE.com Has Been Saying For Years.)
Even the MSM senses an underlying malaise in the job market:
One of the major disappointments in the jobs report was the data on wages in December. Average hourly earnings fell 0.2%—against forecasts for a rise of 0.2%—to slow the year-on-year gain to 1.7%. That was the first drop since July 2013…”Any reasonable explanation for the “first drop” in year-over-year wages since July 2013 must include the trend shown in the following:Average hourly earnings fell for first time since July 2013, By Steve Goldstein, MarketWatch, January 9, 2015
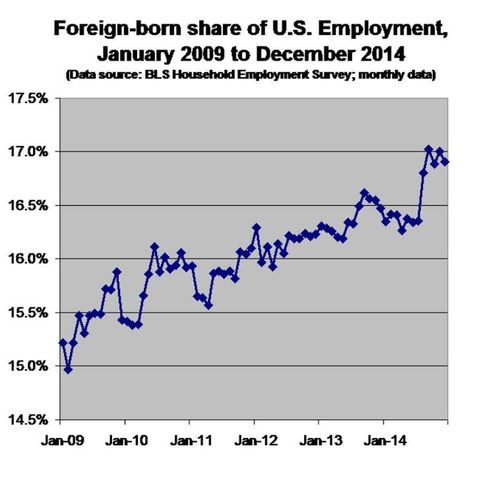
In December 2014 the immigrant share of total employment was 16.91%. That’s the third-highest recorded during the 72-months in which Barack Obama has been chief executive. (It dropped from November’s 17.00%; the Obama-era high, 17.03%, was set in September.)
Immigrants predominate in menial, low-wage jobs which many Americans would gladly fill if given a chance. Low wages are better than no wages. But employers have no scruples when it comes to hiring the easy exploitable—often illegal—newcomers.
With total employment running at about 147 million, every one percentage point gain in the immigrant employment share translates to as many as 1.47 million fewer native-born workers. From February 2009—Obama’s first full month in office—to December 2014 the immigrant share of total employment rose from 14.97% to 16.91%—a gain of 1.94 percentage points. This implies that as many as 2.85 million (1.94 multiplied by 1.47 million) native-born Americans may have lost jobs due to immigration.
Total employment rose 111,000 in December according to the Household Employment Survey—a figure less than half the job growth reported by the more widely-cited Payroll Survey. December was one of the rare months in which native-born American workers gained jobs while immigrants lost them:
In December:
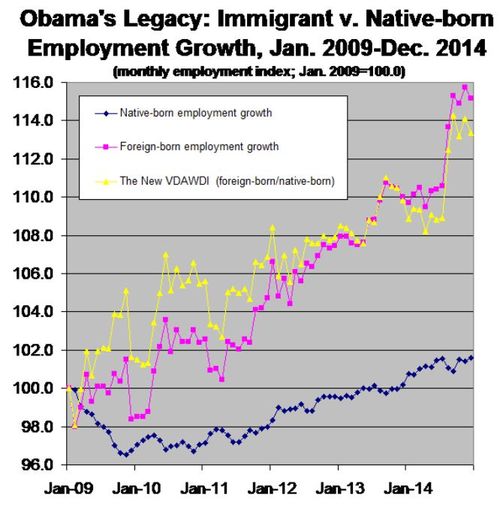
Native-born American employment growth is the black line, immigrant employment growth is in pink, and NVDAWDI—the ratio of immigrant to native-born American job growth—is in yellow. The index starts at 100.0 for both immigrants and native-born Americans in January 2009, and tracks their employment growth since then.
From January 2009 to December 2014:
A more detailed snapshot of American worker displacement over the past year is seen in Household Survey data published in the monthly job report:
| Employment Status by Nativity, Dec. 2013-Dec. 2014(numbers in 1000s; not seasonally adjusted) | ||||
| Dec-13 | Dec-14 | Change | % Change | |
| Foreign born, 16 years and older | ||||
| Civilian population | 38,481 | 39,896 | 1,415 | 3.7% |
| Civilian labor force | 25,429 | 26,286 | 857 | 3.4% |
| Participation rate (%) | 66.1% | 65.9% | -0.2% | -0.3% |
| Employed | 23,787 | 24,890 | 1,103 | 4.6% |
| Employment/population % | 61.8% | 62.4% | 0.6% | 1.0% |
| Unemployed | 1,642 | 1,396 | -246 | -15.0% |
| Unemployment rate (%) | 6.5% | 5.3% | -1.2% | -18.5% |
| Not in labor force | 13,052 | 13,610 | 558 | 4.3% |
| Native born, 16 years and older | ||||
| Civilian population | 208,264 | 209,131 | 867 | 0.4% |
| Civilian labor force | 126,979 | 129,235 | 2,256 | 1.8% |
| Participation rate (%) | 61.9% | 61.8% | -0.1% | -0.2% |
| Employed | 120,636 | 122,300 | 1,664 | 1.4% |
| Employment/population % | 57.9% | 58.5% | 0.6% | 1.0% |
| Unemployed | 8,342 | 6,936 | -1,406 | -16.9% |
| Unemployment rate (%) | 6.5% | 5.4% | -1.1% | -16.9% |
| Not in labor force | 79,286 | 79,896 | 610 | 0.8% |
| Source: BLS, The Employment Situation - November 2014, Table A-7, January 9, 2015. | ||||
Extrapolating these growth rates we find that the foreign-born population of working-age will double in about 19.5 years. It will take 180 years for the native-born population to match that. By then, of course, immigrants will dominate the U.S. workforce.
More troubling still is the gap between the foreign-born working-age population growth (reported by BLS to be 1.42 million over the past 12 months) and the number of immigrants of all ages admitted legally, which has been running at about 1 million per year according to Homeland Security data.
Obvious implication: A strong U.S. job market is drawing illegals into country.
Not to worry: President Obama has announced an unconstitutional Executive Amnesty giving legal status and work permits to millions of illegal immigrants—what VDARE.com calls “Obamnesty.”. The GOP Congressional leadership may, or may not, attempt to stop him next week.
What’s obviously needed is an immigration moratorium. But a bipartisan coalition in Congress, and the president, are blindly committed to efforts to increase the level of legal immigration, such as Senate Bill 744 that passed that chamber last year.
It doesn’t look like this will end well.
Edwin S. Rubenstein (email him) is President of ESR Research Economic Consultants.


